2 CBM_dataPrep
This documentation is work in progress. Potential discrepancies and omissions may exist for the time being. If you find any, please contact us here.
2.1 Overview
CBM_dataPrep processes spatially explicit inputs for use in CBM_vol2biomass and CBM_core. In SpaDES-speak, it has two events, the init event (scheduled once) and the readDisturbanceEvents which processes disturbances (usually provided as rasters) into a table format used in CBM_core. SpaDES was designed for spatially explicit modelling and provides a wide variety of tools to support it. CBM_dataPrep makes use of these tools. We use an example that simulates a scenario where remotely-sensed disturbances are simulated in the managed forests of Saskatchewan from 1985 to 2011, as described in Boisvenue et al. (2016) (scenario = time horizon + disturbances).
2.2 Background
The default structure of SpaDES modules has the .inputObjects function, and in this function in CBM_dataPrep, we make use of the reproducible::prepInputs function, an important part of the SpaDES toolkit (see the SpaDES training manual for more details), enabling repeatable continuous workflows.
This module reads in various spatially explicit Canada-wide rasters that are processed and cropped to our study area defining masterRaster. The characteristics (projection, resolution, etc.) of this masterRaster are transferred to other rasters used in the simulation via the function reproducible::prepInputs. All rasters are matched to the masterRaster using the reproducible::prepInputs function.
2.3 Inputs
| Name | Class | Description | Source |
|---|---|---|---|
| masterRaster | SpatRaster | Raster of study area | User provided, for SK: Google Drive |
| ecoLocator | SpatRaster | Canada’s ecozone as polygon features with ecozone IDs | Canadian Soil information Service |
| adminLocator | SpatRaster | Spatial data source of Canada’s administrative boundary names | Statistics Canada |
| ageLocator | SpatRaster | Spatial data source of cohort ages or a single value to use for all cohorts | user provided, for SK: Google Drive |
| ageDataYear | Numeric | Year that the ages in ageLocator represent |
CBM_dataPrep_SK |
| ageBacktrackSplit | Character | Optional. If backtracking ages, split the age layer by these cohortDT or gcMeta columns when interpolating ages |
User Provided |
| ageSpinupMin | Numeric | Minimum age for cohorts during spinup | CBM_dataPrep_SK |
| gcIndexLocator | SpatRaster | Raster giving the growth curve value for each pixel | User provided, for SK: Google Drive |
| cohortLocators | List | List of values or spatial data sources for additional columns in cohortDT
|
|
| curveID | Character | Column(s) uniquely defining each growth curve in cohortDT, userGcMeta, and userGcM3
|
CBM_dataPrep_SK |
| userGcMeta | Data table | User provided growth curve data | Growth curve metadata for CBM_vol2biomass |
| gcMeta | Data table | Growth curve metadata | |
| disturbanceRasters | List | Disturbance rasters for the study area for the duration of simulation | User provided, for SK: Google Drive |
| disturbanceSource | Character | Names of disturbance sources available to use. | default is NTEMS |
| disturbanceMeta | Data table | Table defining the disturbance event types | User provided, for SK: Google Drive |
2.4 Module functioning
CBM_dataPrep has 4 events; prepCohorts, prepVol2Biomass, MatchSpecies, and MatchDisturbances, which are run only once, and the readDisturbances event, which is repeated for each simulation year.
2.4.1 prepCohorts
This event reads in the study area’s spatial inputs from CBM_dataPrep_SK and processes them into two tables, cohortDT and standDT to be used in CBM_core.
2.4.2 prepVol2Biomass
This short event defines the unique growth curves that will be used int he CBM_vol2Biomass module based on spatial units.
2.4.3 MatchSpecies
Here the module matches species in user provided data tables to get additional attributes, such as CBM-specific species IDs needed in later modules.
2.4.4 MatchDisturbance
This event matches disturbances event types to its appropriate CBM-specific disturbance type ID.
2.4.5 readDisturbances
This event serves to process disturbance events for each simulation year. Separating this processing from the other events enables dynamic linkages to disturbance models. However, in our example, disturbances are provided in the form of remotely-sensed disturbance rasters. This is the only event in this module that is run more than once.
2.4.6 Disturbances
There are 468 unique disturbance matrices identified in the defaults. Since root parameters and snag carbon transfer rates have hardwood and softwood specific rates, each disturbance has a hardwood and a softwood instance, which means we have 234 unique disturbances across Canada as defaults in this modelling system, one for hardwood and one for softwood. A user could add or modify the proportions transferred between pools to represent a disturbance.
Figure 1: Proportional carbon transfers between pools during a fire in Saskatchewan
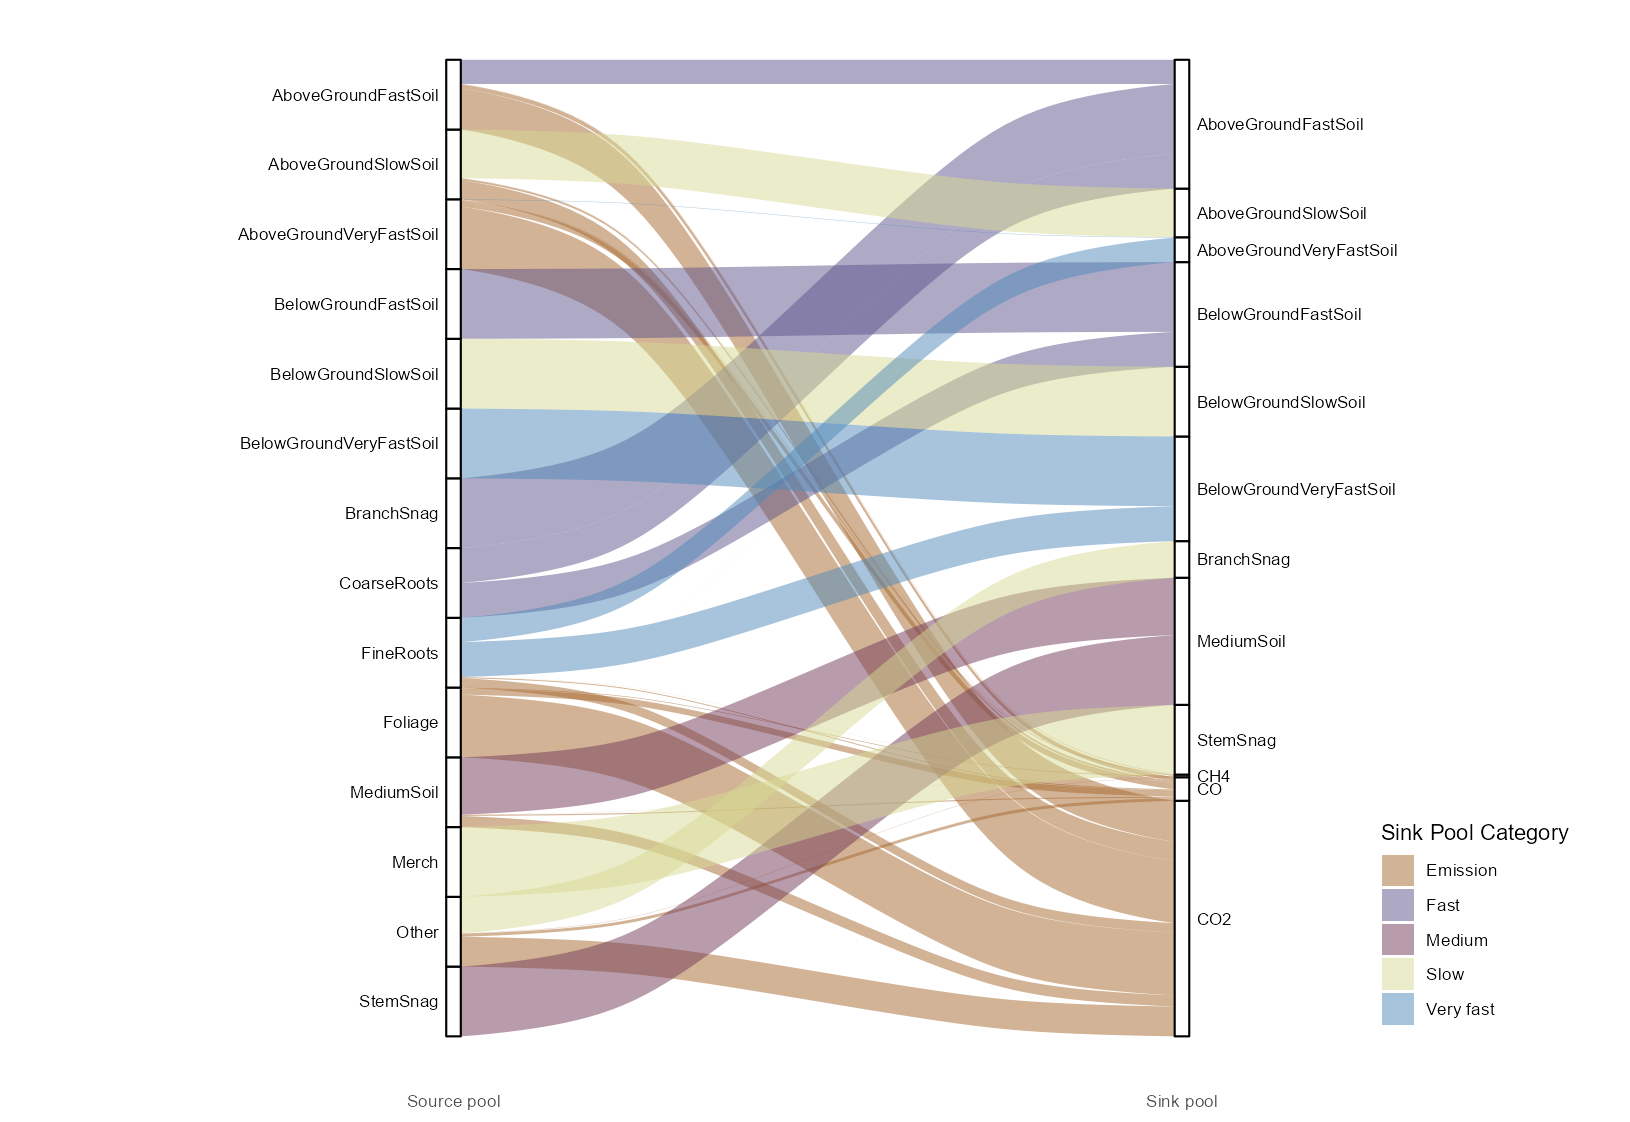
There are a series of helper functions in CBMutils to help users explore and navigate disturbance matrices: - spuDist() for extracting the disturbances in a specific spatial unit, - simDist() which lists the disturbances used in a simulation, and - seeDist() which pulls out the proportions from source to sink pools.
Because growth curves can be identified by strata, multiple columns can be used to identify growth curves using the curveID object. In our example, only gcids is used.
2.5 Outputs
| Name | Class | Description |
|---|---|---|
| standDT | Data table | Table of stand attributes. Stands can have 1 or more cohorts |
| cohortDT | Data table | Table of cohort attributes |
| userGcSPU | Data table | Table of growth curves and spatial unit combinations for each cohort |
| userGcMeta | Data table | Growth curve metadata with additional species attributes |
| gcMeta | Data table | Growth curve metadata |
| disturbanceEvents | Data table | Table with disturbance events for each simulation year |
| disturbanceMeta | Data table | Table defining disturbance event types |